
Stats 3.0.24 macOS 系统状态实时监控工具
macOS 原生并未提供便捷的途径来实时查看 CPU、GPU 等核心部件的温度,也无法直观掌握整机功耗情况。Stats 将这些关键硬件指标直接呈现在菜单栏中——轻量、免费、完全开源。
- 支持自定义传感器监控列表,只显示你真正关心的硬件数据,界面清爽不冗余。
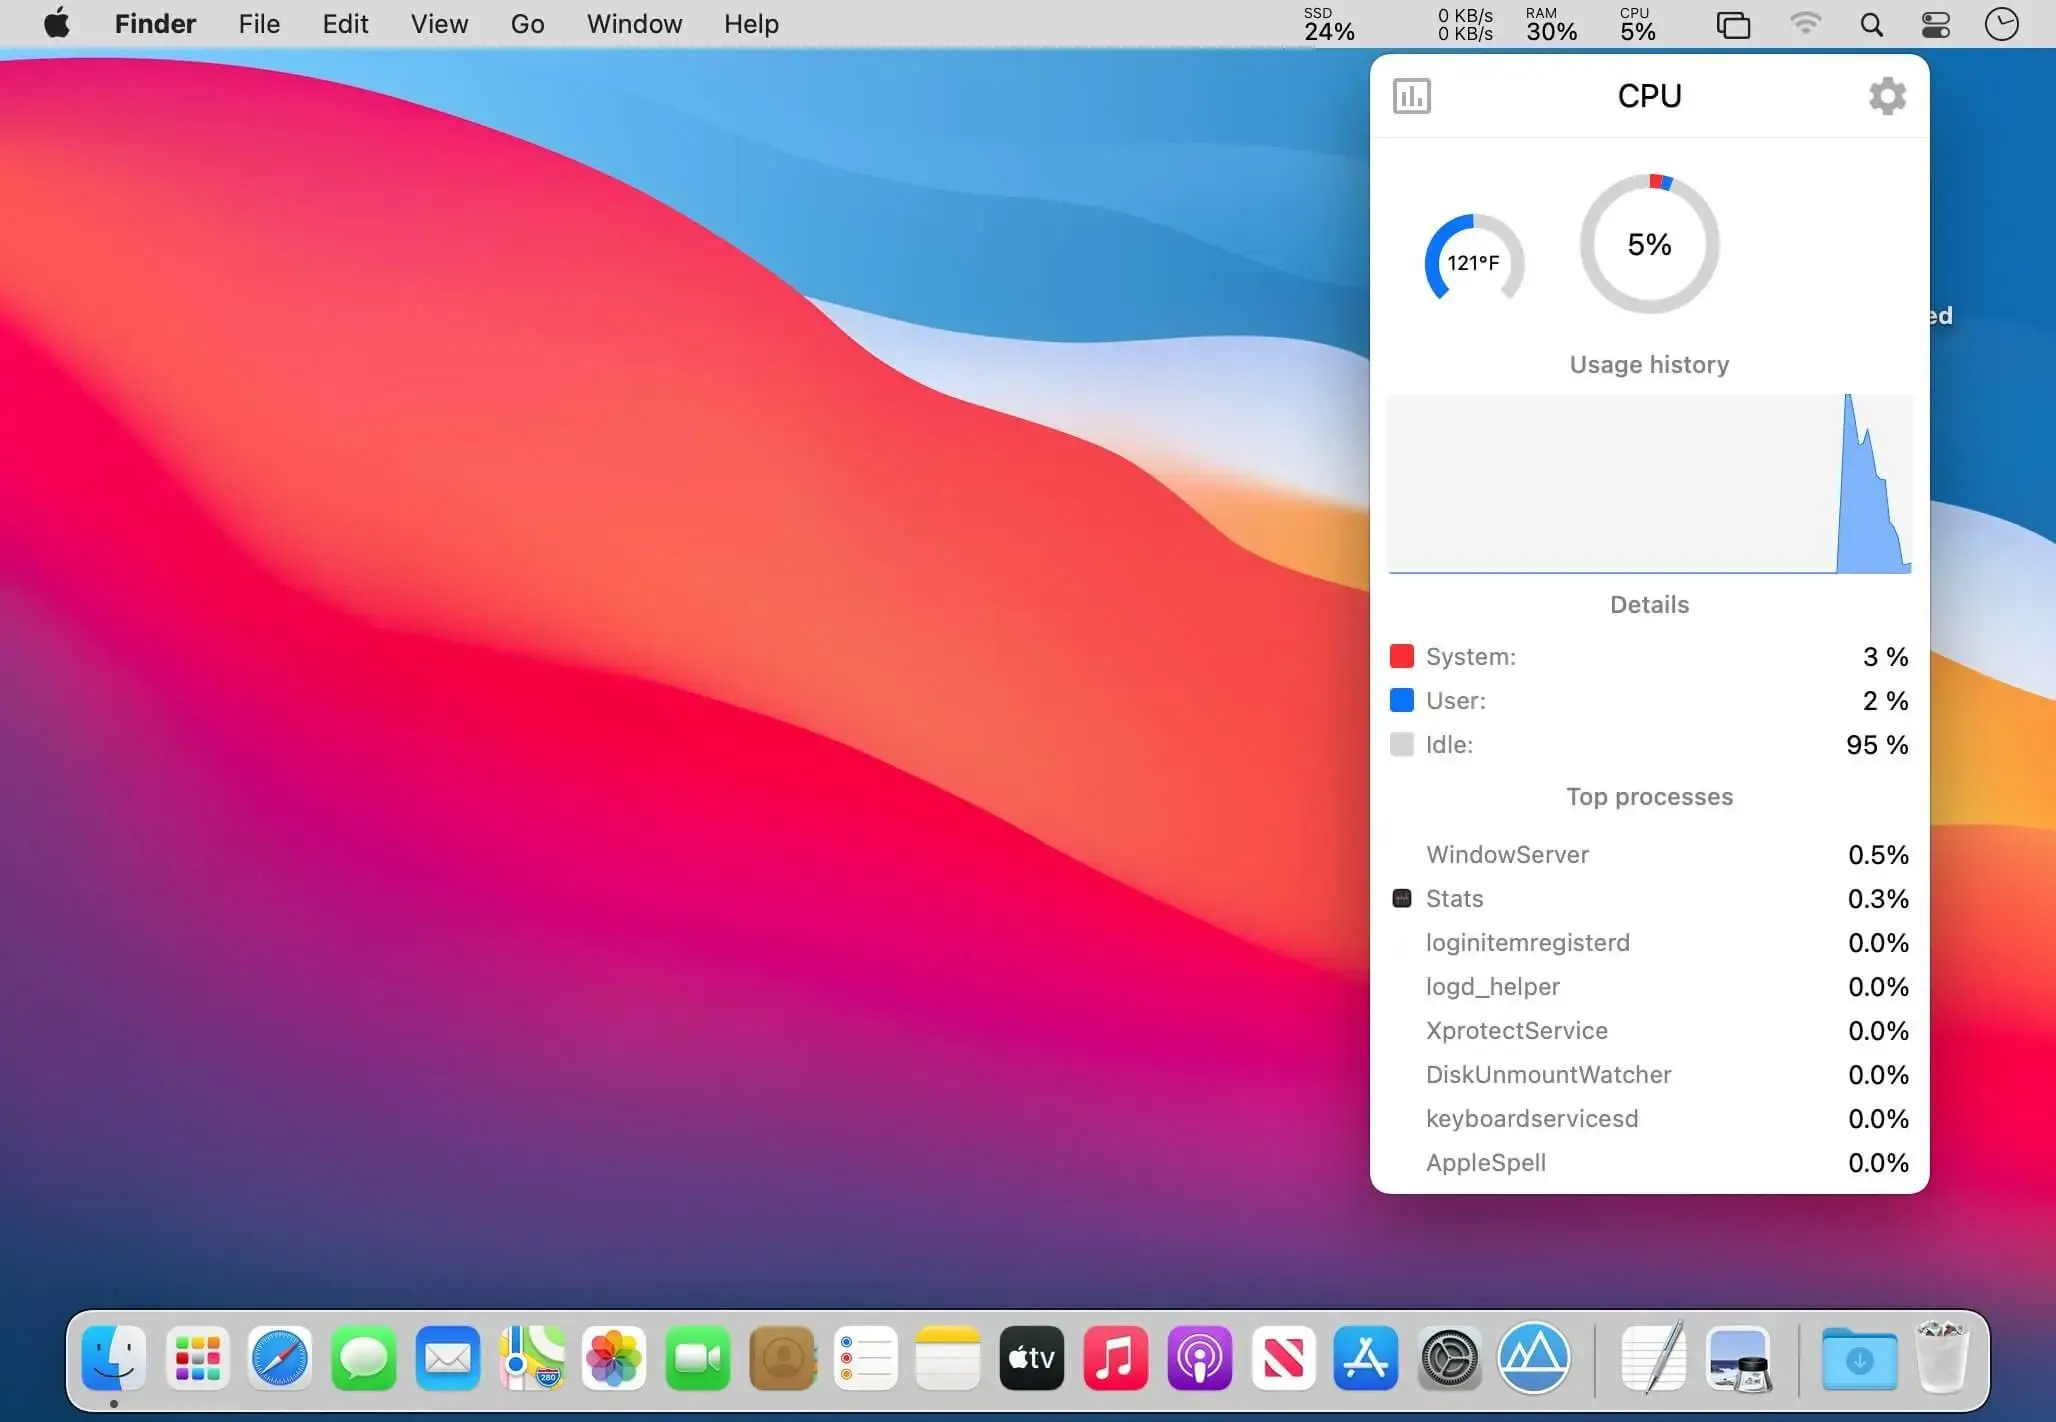
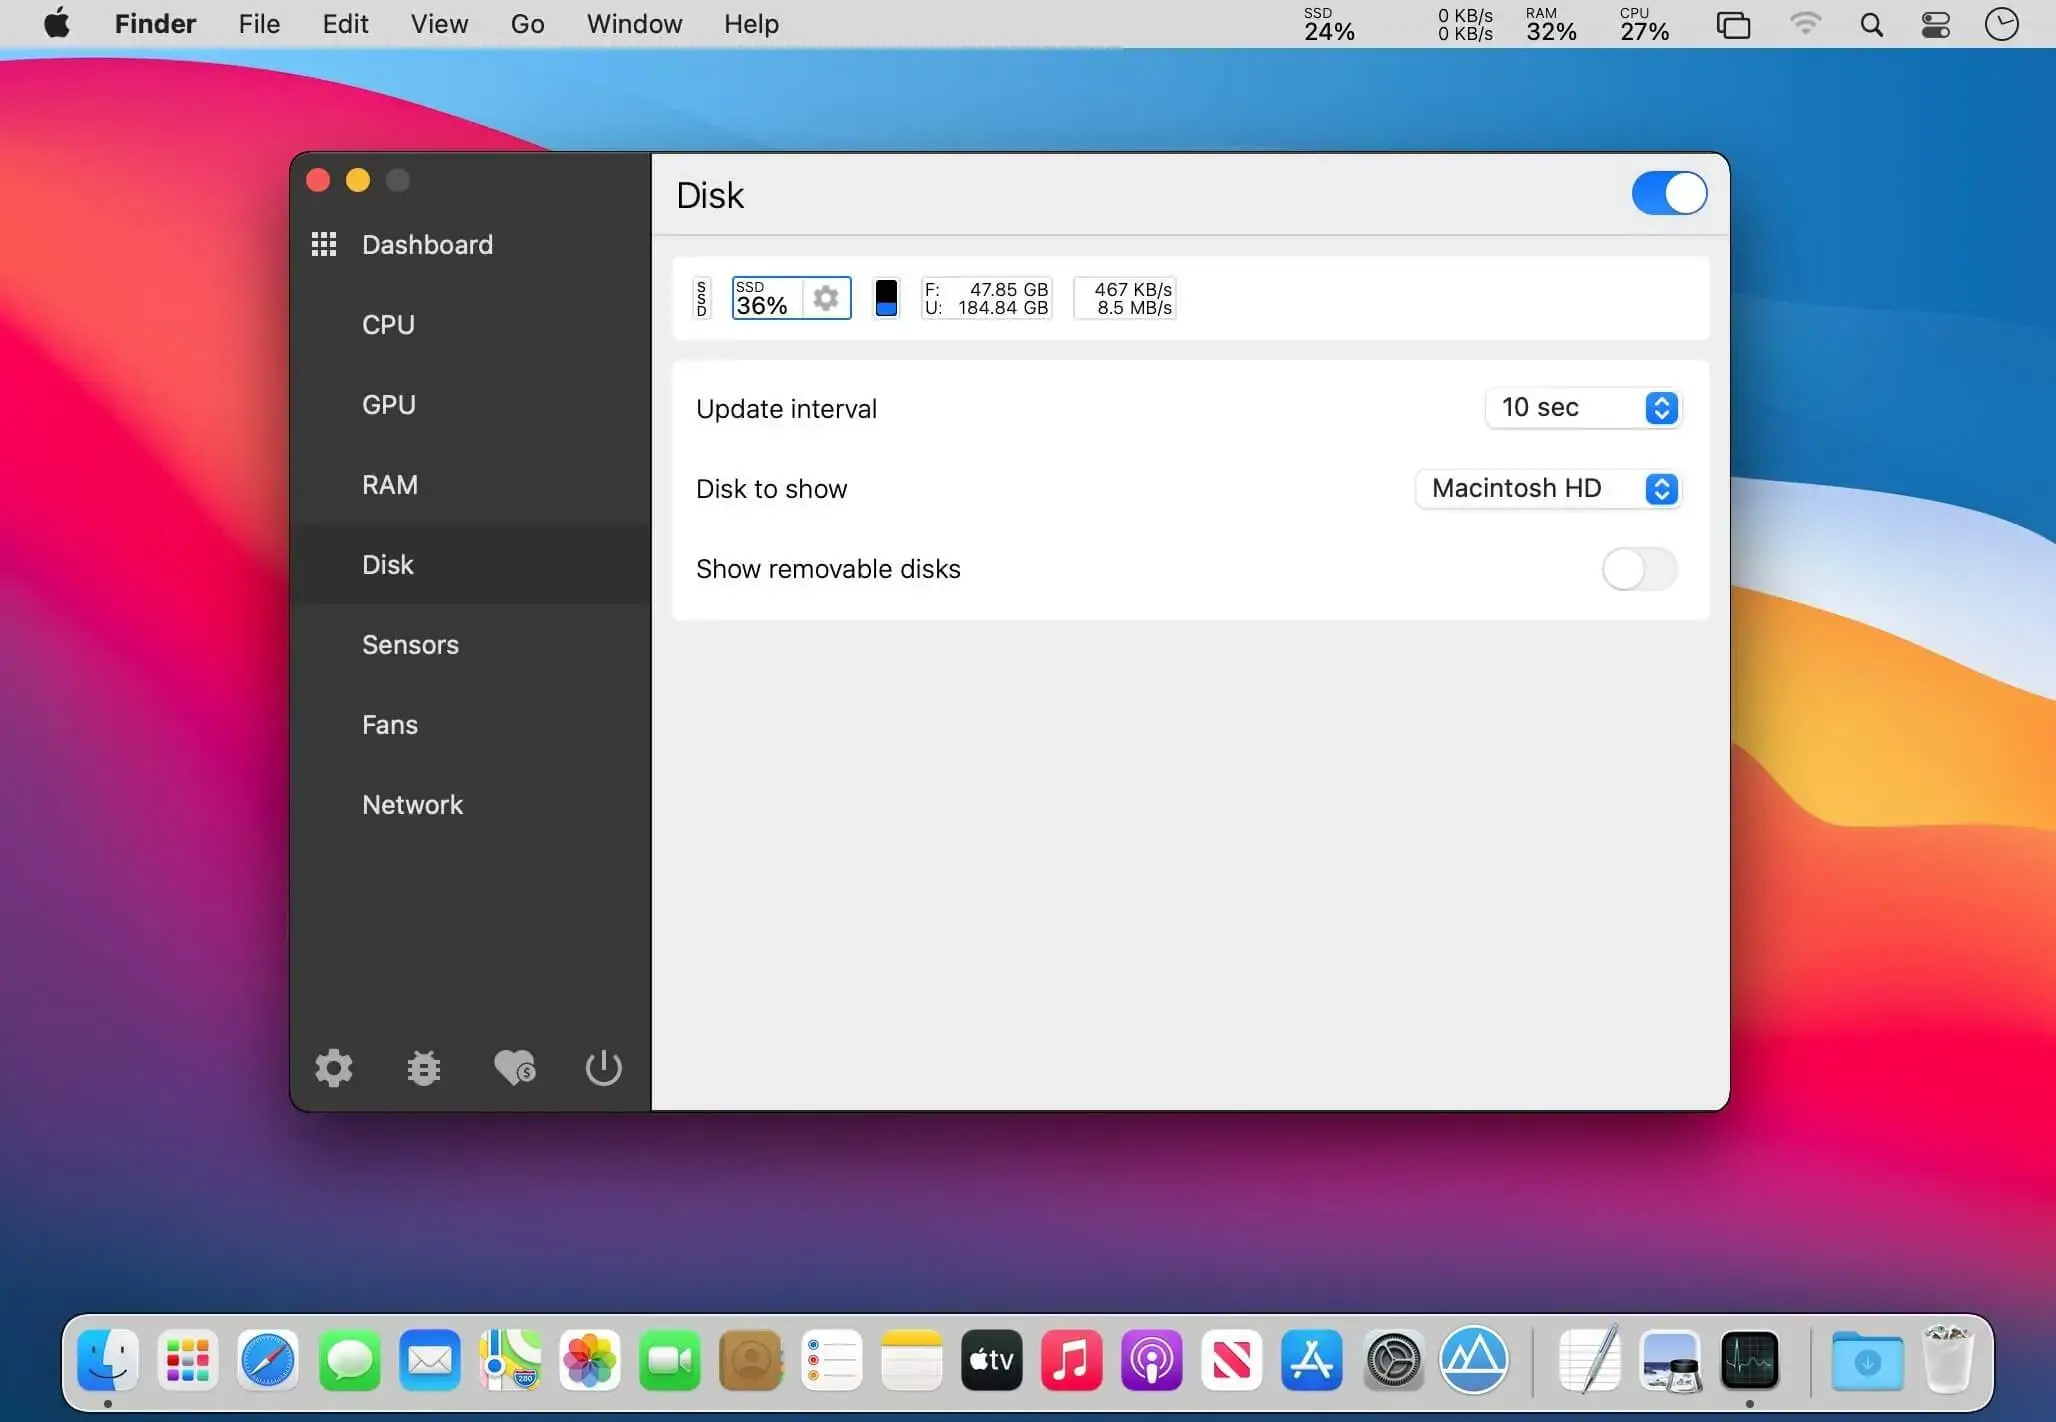
- 除温度与功耗外,CPU 占用率、内存使用量、磁盘 I/O 及网络吞吐量也一并集成,每类指标均以独立图标呈现,可自由拖拽排序。
- 任意点击任一数值,即可展开详细图表与历史趋势分析。
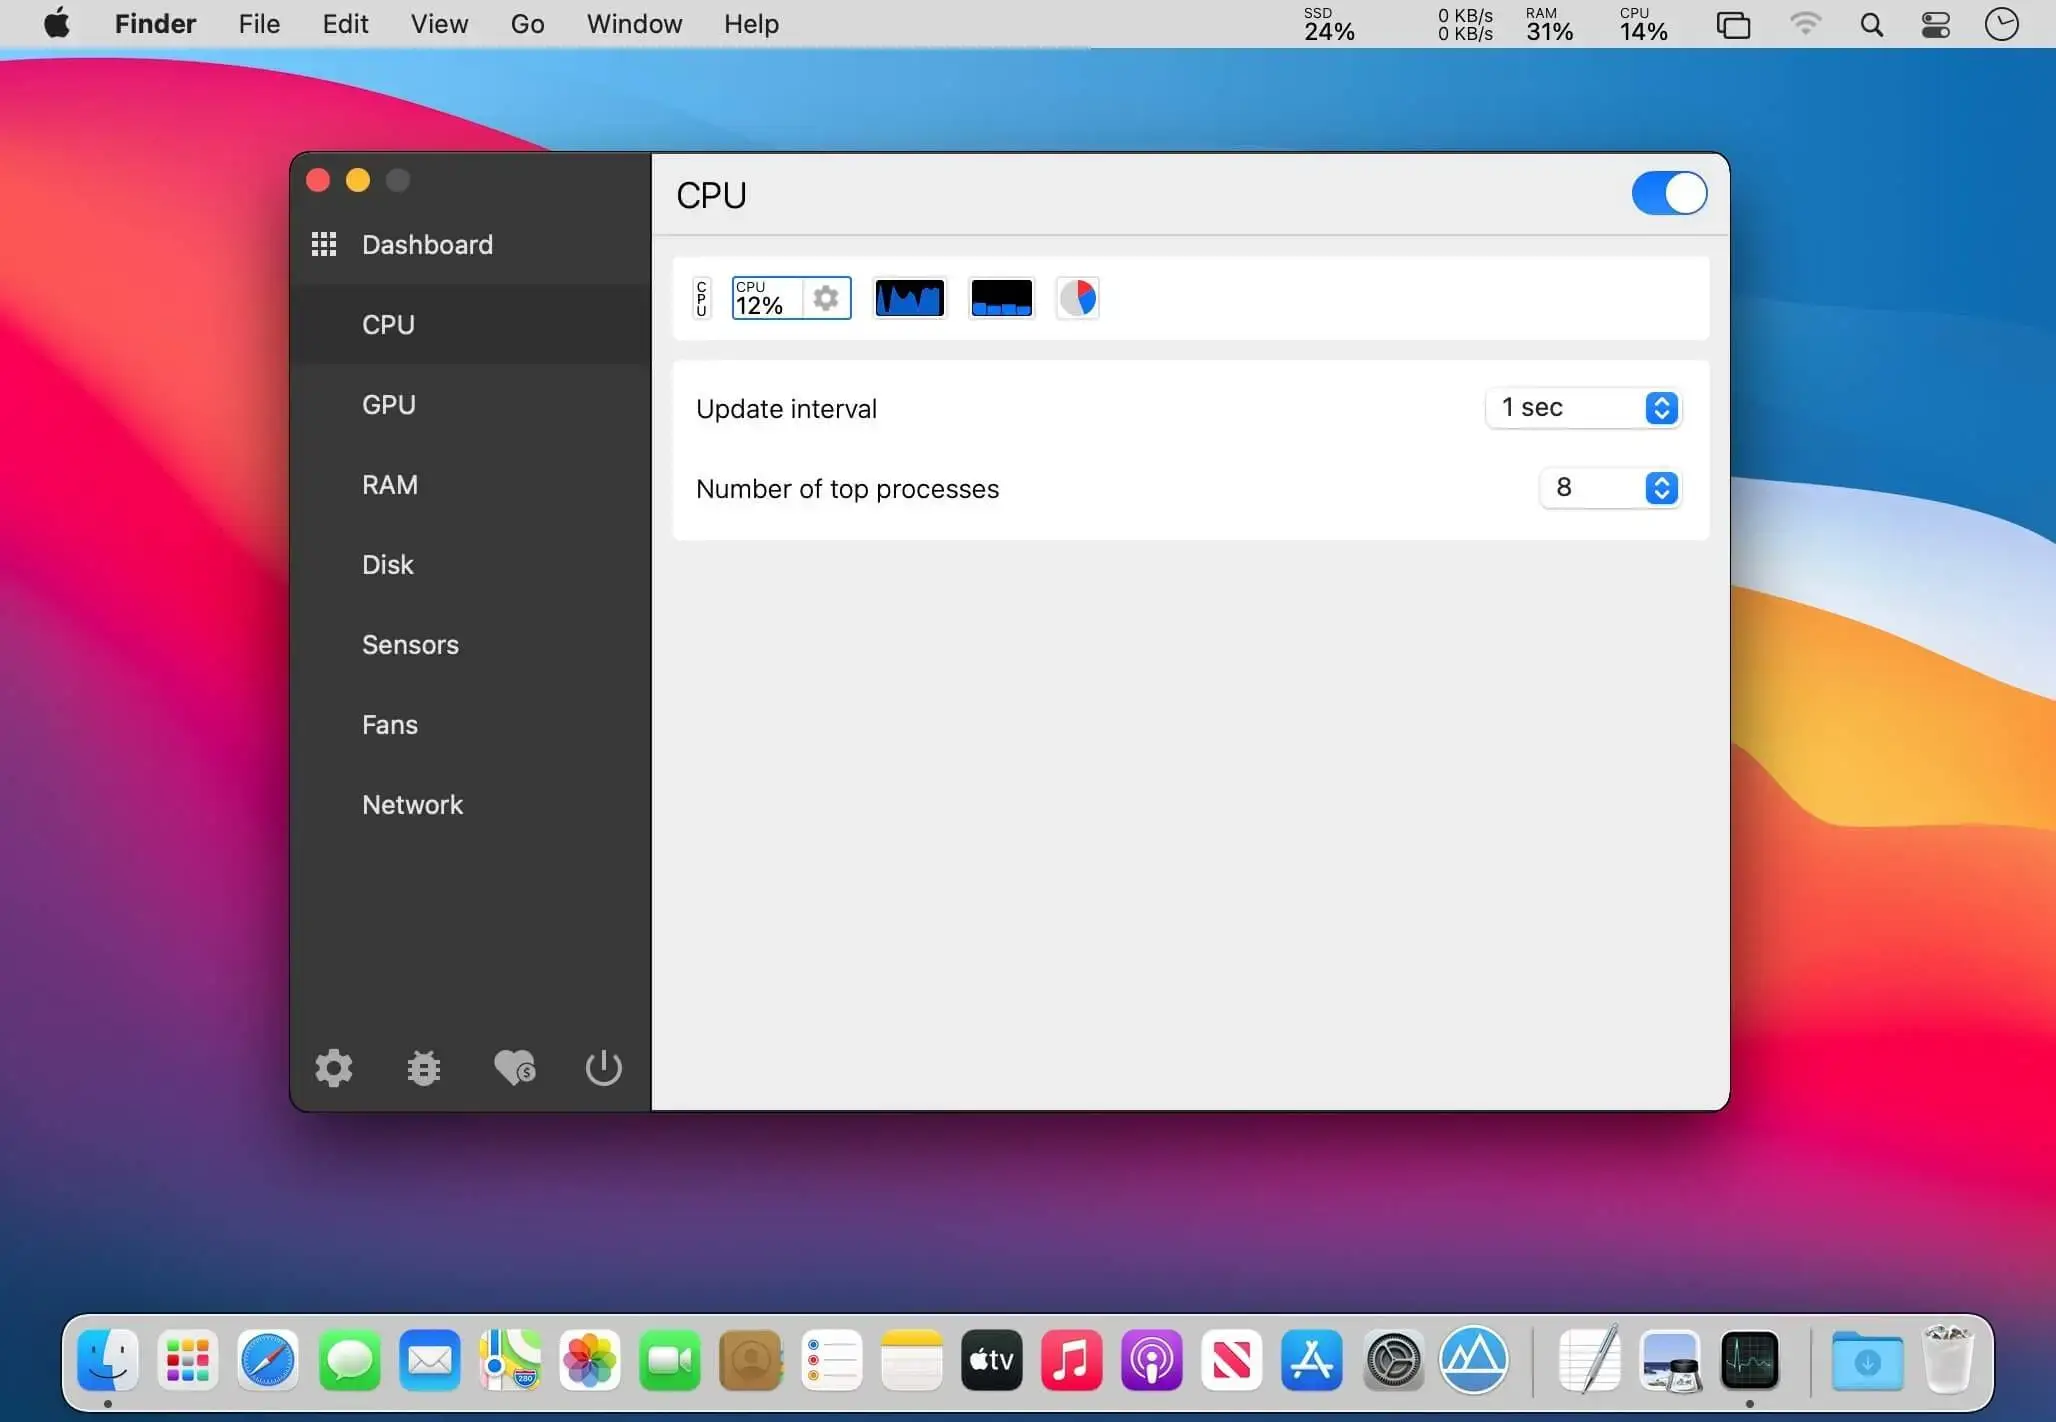
- 内置多种指示器样式(如数字、进度条、环形图等),标签文字可选显隐,有效提升小尺寸图标下的可读性。
- 刷新频率由你掌控——从 1 秒到 60 秒自由设定,兼顾精度与系统资源消耗。
- 电池剩余电量与健康状态始终与其他指标并列显示,状态一目了然。
- 项目持续活跃开发中,后续将陆续加入风扇控制、进程级功耗分析等进阶功能。
What's New
Version 3.0.24
Bug fixes
- fix: moved popup from NSWindow to NSPanel to prevent window flickering when switching between popups (#3619)
- fix: fixed the input stretching in StepperInput with a unit picker
- fix: fixed duplicated items in the menu bar when enabled combined modules with single icon and pause the app
New features
- feat: updated the Network public IP endpoint to ip.mac-stats.com
- feat: adjuster the Dock icon option when no windows are open (#3714)
- feat: added Sensors module support for System Stats and reduced Remote payload sizes
- feat: added an option to specify modules for System Stats monitoring
- feat: replaced the custom menu bar graph with the app icon
- feat: updated speeds formatter to always show two decimal places with fixed units (#3376)
- feat: added top processes to the GPU module (#3710)
- feat: added a preview overlay with an enable button for disabled modules
- feat: replaced the app icon with an Icon Composer icon
Localization
- lang: corrected Persian translations (#3720)
- lang: added translations for the unavailable preview message when a module is disabled